The majority of current pavement condition assessment techniques are labor-intensive and
manual. Existing techniques for identifying and evaluating potholes rely on 3D surface
reconstruction, which is expensive in terms of both hardware and compute, or on acceleration
data, which only yields preliminary results. We are looking for teams to propose a low-cost
method for automatically identifying potholes and judging their severity using vision-based data
for both 2D and 3D reconstruction.
Utilizing the visual and spatial qualities of potholes as well as the measurement parameters
(width, quantity, and depth) that are used to estimate pothole severity, we would like to
understand how both 2D and 3D reconstruction can be combined to improve recognition results.
While the width and depth of the potholes are determined using 3D reconstruction, the number
and location of potholes is determined using 2D recognition.
Data gathering, distress identification and classification, and distress evaluation are the three
steps in the pavement assessment process. Modern data collection techniques are being quickly
replaced by inspection vehicles. These inspection vehicles can gather data at speeds of up to 60
mph (96 km/h), thanks to their numerous sensors, which include cameras for surface imaging,
optical sensors for distance measurement, laser scanners for profiling, ultrasonic sensors for
rutting detection, and accelerometers for roughness measurements. The second and third
processes of distress classification and assessment are still mostly manual despite the
automation of the data collection procedure. Currently, technicians manually examine the
collected data to determine the existence of distresses and gauge their severity from the
computer screen. Such a labor-intensive manual method might become unsystematic due to the
volume of data that needs to be collected, which eventually lowers the assessment's quality.
Although there are clear rules for manual diagnosis and assessment of asphalt distress, the
technicians' experience affects the assessment's outcome. A hybrid imaging device that
combines digital cameras and infrared lasers to capture continuous images of lines projected by
infrared lasers is based on 3D surface profiles from time-of-flight laser scanners to classify and
quantify pavement deterioration. These commercial software programs do not, however, count
or identify all the potholes that have been spotted.
Dataset:
https://drive.google.com/file/d/1iYgiw4B4uHG78trDbJ9n63ZKCEH96vvx/view
Challenge:
We challenge the community to explore (1) novel approaches using computer vision for
classification of pothole severity in roads and (2) propose potential pipelines that would allow
city planners to assess pothole severity in roads in a cost-effective manner.
Your challenge is to generate actionable, practical, and novel insights from video and picture
data of roads that devise innovative and data-driven approaches to analyzing road conditions,
prioritization of work to be done on roads, and classification of severity of potholes and cracks
on roads.
There are several potential items to analyze:
These include, but are not limited to:
● Pipeline that automatically detects the bounding boxes or segments of the potholes
within the visual footage.
● Pipeline that automatically creates a 3d point cloud reconstruction of the road, including
the potholes.
● Use of both 2D and 3D data to automatically classify severity and characteristics of the
potholes detected, and based on this data determine which potholes are top priority for
resolution.
● Accuracy of the measurement in terms of:
○ Width and Height of the Pothole (in cms)
○ Depth of Pothole (in cms)
○ Estimated shape of the pothole detection.
● Metric that determines the segments of the road that require the most immediate
attention.
A potential approach
PLEASE NOTE: Contestants should not feel limited to these suggestions.
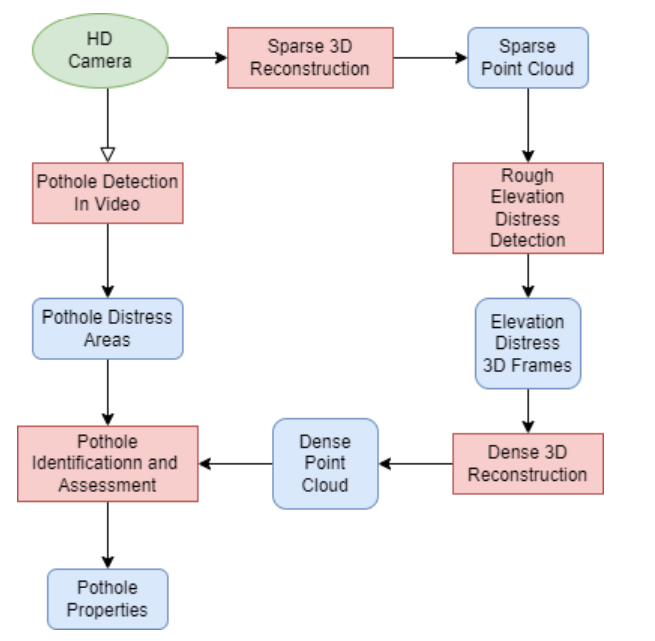
First, videos captured by a High Definition camera are utilized to look for potholes.
Simultaneously, a sparse first 3D reconstruction is performed using the same footage. Potholes
are confirmed to exist in order to decrease the amount of places that are incorrectly classified as
potholes based on the findings of 2D detection and 3D sparse reconstruction. Next, a dense
reconstruction approach is used to enhance the results of the sparse 3D reconstruction. The
geometrical characteristics of the potholes and their severity are measured using the dense 3D
point cloud model and the output from the 2D appearance-based recognition.
PLEASE NOTE: Contestants should not feel limited to these suggestions.
Based on the 2D localization data the location of the Pothole within the frame can be determined
using YOLO, Faster R-CNN, or any other Computer Vision based object localization method.
Teams are free to propose their preferred method.
3D reconstruction of the scene could be done using Computer Vision techniques. Teams may
propose any algorithm to generate 3d point clouds and later meshes from overlapping pictures
of the road. Any available structure from motion algorithms or software can be used, including
commercially available packages and packages available in the open source. Most commercial
alternatives offer free trials.
Scoring
An entry to the competition consists of a Notebook submission that is evaluated on the following
five components, where 0 is the low score and 10 is the high score. Submissions will be judged
based on how well they address:
Innovation:
● Are the proposed approaches actionable?
● Is this a way of evaluating road conditions that is novel?
● Is this project creative?
Accuracy:
● Are the results similar to ground truth data?
● Is the method by which these results obtained clearly explained?
Relevance:
● Would Cities benefit from using this approach?
● Would this potentially be able to scale in a cost-effective manner versus standard
methods of road condition evaluation?
Judges will consist of city planners, and computer vision specialists that are working for either
Saudi Data and Artificial Intelligence Authority (SDAIA), Ministry of Municipal, Rural Affairs, and
Housing, and Royal Commission for Riyadh City. Scores will be averaged so that each of the
components above is weighed equally.
Notebook requirements
All notebooks submitted must be made public on or before the submission deadline to be
eligible. If submitting as a team, all team members must be listed as collaborators on all
notebooks submitted.


